Pharmacy Technician Salary in Minnesota: $51,064 (2026)
Quick Answer:Across Minnesota's 44 metropolitan areas, the average median pharmacy technician pay sits at $51,064/year heading into 2026 — a figure projected from 2025 BLS OEWS wage data for SOC 29-2052. Because Minnesota sits at BEA RPP 98.5 (1% below the U.S. baseline), that statewide median translates to roughly $51,842 in nationally-comparable purchasing power. Highest-paying metros: Rochester ($50,730), Maple Grove ($49,056), Woodbury ($49,037).
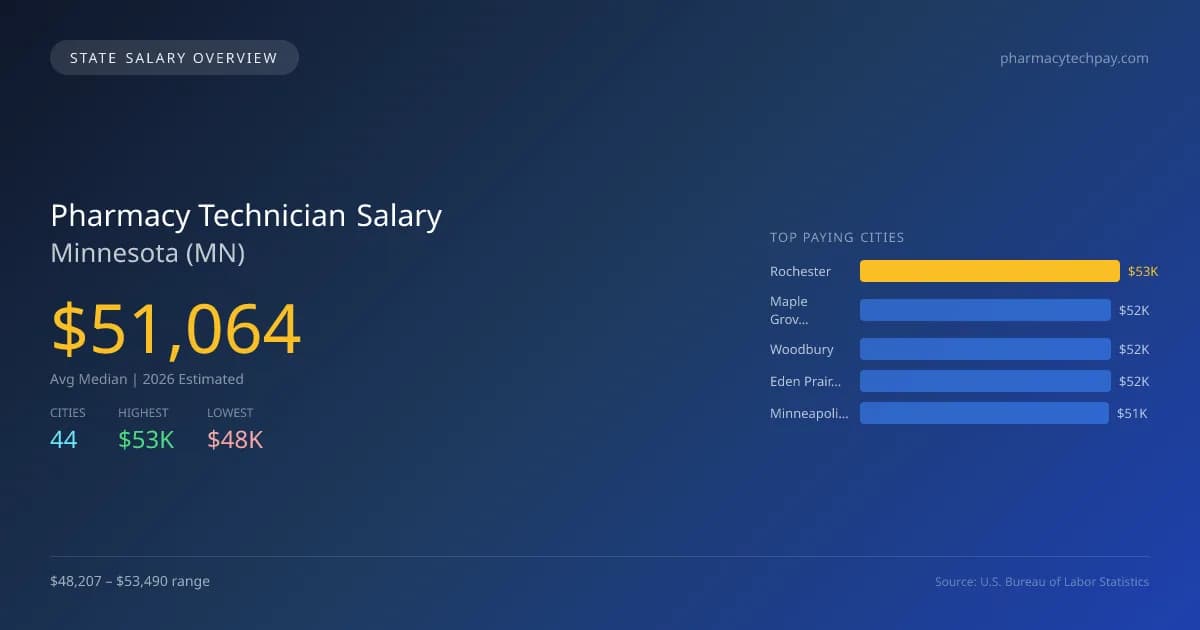
In Minnesota, the average median salary for pharmacy technicians is projected to be $51,064 in 2026, which is 5.9% higher than the national median of $48,239. The salary ranges substantially across the state, with Rochester leading at $53,490, while Faribault offers a lower salary of $48,207, creating a gap of $5,283 between the highest and lowest paying cities. This disparity can be attributed to factors such as the cost of living, demand for healthcare services, and availability of roles in urban versus rural areas. Minnesota has specific licensing requirements and practice laws that dictate the scope of pharmacy technician roles, including the need for state certification and continuing education. Demand for pharmacy technicians is expected to grow at an annual compound growth rate of 5.44%. This growth is fueled by an increasing aging population, expanded roles for pharmacy technicians within healthcare teams, and advancements in pharmaceutical care. With 6,362 pharmacy technicians employed across 44 metro areas, the job outlook appears strong. Cities like Maple Grove ($51,725), Woodbury ($51,705), Eden Prairie ($51,656), and Minneapolis ($51,159) also reflect promising salaries, indicating that career opportunities in this field continue to expand in Minnesota.
Minnesota Pharmacy Technician Salary Range
Overall salary range in Minnesota: $37,709 (lowest entry-level) to $75,284 (highest top earner)
Minnesota vs National Average
Minnesota pharmacy technicians earn 5.86% more than the national median (+$2,825/year difference).
Minnesota Pharmacy Technician Salary Distribution (2026)
Pharmacy Technician salaries in Minnesota range from $40,534 (entry-level, 10th percentile) to $65,684 (top earners, 90th percentile), with a median of $51,064. The Minnesota median is $2,825 above the US national median of $48,239. The average hourly rate is $24.55/hr. Approximately 6,362 pharmacy technicians are employed across 44 cities.
2019 BLS Actual
$38,112
2025 BLS Actual
$48,429
2026 Current Est.
$51,064
2019–2027 Growth
+41.3%
Salary Trajectory for Pharmacy Technicians in Minnesota (2019–2027)
2019–2025: actual BLS OEWS data for this metro area. 2026+: CAGR 5.44% projection.
| Year | Annual Salary | Status |
|---|---|---|
| 2019 | $38,112 | Actual |
| 2020 | $39,810 | Actual |
| 2021 | $44,112 | Actual |
| 2022 | $44,064 | Actual |
| 2023 | $47,343 | Actual |
| 2024 | $48,498 | Actual |
| 2025 | $48,429 | Actual |
| 2026(current) | $51,064 | Estimated |
| 2027 | $53,842 | Projected |
Based on 7 years of BLS OEWS data for the Minnesota metropolitan area, the median pharmacy technician salary grew 27.1% from $38,112 (2019) to $48,429 (2025). At a 5.44% compound annual growth rate, salaries are projected to reach $53,842 by 2027 — a total increase of $15,730 (41.27%) from 2019.
Note: Historical values (2019–2025) are actual BLS OEWS figures for the Minnesota metropolitan area, sourced from annual Occupational Employment and Wage Statistics surveys. 2026–2026 figures are current estimates, and 2027 values are projections, calculated using a 5.44% CAGR derived from 7-year BLS historical data. Actual salaries may vary based on employer, experience, certifications, and local market conditions.
Top 5 Highest Paying Cities in Minnesota
Lowest Paying Cities in Minnesota
Best Value Cities for Pharmacy Technicians in Minnesota
When adjusted for local cost of living, these Minnesota cities offer the most purchasing power for pharmacy technicians.
| City | Nominal Salary | CoL Index | Adjusted Salary |
|---|---|---|---|
| Rochester | $53,490 | 90.821 | $58,896 |
| Duluth | $50,095 | 88.768 | $56,434 |
| Mankato | $51,033 | 90.955 | $56,108 |
| St. Cloud | $48,787 | 87.632 | $55,673 |
| Maple Grove | $51,725 | 98.5 | $52,513 |
Adjusted salary = nominal salary × (100 / CoL index). CoL index: 100 = national average. Lower index = lower cost of living.
Salary by Experience Level in Minnesota
| Experience Level | Estimated Annual |
|---|---|
| Entry Level (0-2 years) | $40,534 |
| Mid Career (3-7 years) | $51,064 |
| Experienced (7+ years) | $65,684 |
Estimates based on BLS percentile data averaged across Minnesota metro areas. Individual pay varies by employer, certifications, and specialization.
All 44 Cities in Minnesota
| # | City | Median Salary |
|---|---|---|
| 1 | Rochester | $53,490 |
| 2 | Maple Grove | $51,725 |
| 3 | Woodbury | $51,705 |
| 4 | Eden Prairie | $51,656 |
| 5 | Minneapolis | $51,159 |
| 6 | Mankato | $51,033 |
| 7 | Owatonna | $50,661 |
| 8 | St. Paul | $50,646 |
| 9 | Brooklyn Park | $50,593 |
| 10 | Plymouth | $50,505 |
| 11 | Roseville | $50,474 |
| 12 | Chaska | $50,435 |
| 13 | Minnetonka | $50,424 |
| 14 | Cottage Grove | $50,368 |
| 15 | Burnsville | $50,327 |
| 16 | Bloomington | $50,253 |
| 17 | Lakeville | $50,141 |
| 18 | Chanhassen | $50,106 |
| 19 | Duluth | $50,095 |
| 20 | Inver Grove Heights | $50,027 |
| 21 | Eagan | $50,020 |
| 22 | Brooklyn Center | $50,007 |
| 23 | Elk River | $49,999 |
| 24 | Prior Lake | $49,948 |
| 25 | Ramsey | $49,766 |
| 26 | Blaine | $49,555 |
| 27 | Apple Valley | $49,478 |
| 28 | Shakopee | $49,429 |
| 29 | Coon Rapids | $49,421 |
| 30 | Savage | $49,342 |
| 31 | Edina | $49,336 |
| 32 | Maplewood | $49,191 |
| 33 | Andover | $49,179 |
| 34 | Richfield | $49,155 |
| 35 | St. Louis Park | $49,152 |
| 36 | Moorhead | $49,080 |
| 37 | St. Cloud | $48,787 |
| 38 | Northfield | $48,725 |
| 39 | Hastings | $48,622 |
| 40 | Fridley | $48,403 |
| 41 | Winona | $48,363 |
| 42 | Shoreview | $48,343 |
| 43 | Austin | $48,268 |
| 44 | Faribault | $48,207 |
More Minnesota Salary Data
Hourly Rates
Explore pharmacy technician hourly pay in Minnesota cities.
Senior / Experienced
Top earner salaries for experienced pharmacy technicians.
Compare Cities in Minnesota
View all comparisons →Explore More Pharmacy Technician Salary Data
Frequently Asked Questions
How much do pharmacy technicians make in Minnesota in 2026?
What is the highest paying city for pharmacy technicians in Minnesota?
How does Minnesota pharmacy technician pay compare to the national average?
What is the entry-level pharmacy technician salary in Minnesota?
How many pharmacy technicians are employed in Minnesota?
Which Minnesota city offers the best value for pharmacy technicians?
Written by Emily Tran, PharmD
Career Analyst
Emily Tran has over 8 years of experience as a pharmacy technician. She specializes in medication therapy management. Her experience includes working in community pharmacies.
Methodology & Data Source
Statewide salary figures on this page are 2026 projections based on the Bureau of Labor Statistics Occupational Employment and Wage Statistics (OEWS) survey, May 2026 release. A 5.44% compound annual growth rate (CAGR), derived from 6-year national BLS wage trends, was applied to each metro area's reported salary to estimate current 2026 pharmacy technician compensation across Minnesota. State averages are employment-weighted across 44 metro areas — larger metro areas with more pharmacy technicianscontribute proportionally more to the average, producing figures that better reflect typical compensation. Individual pay varies by city, employer, certifications, and experience.
Data Sources & Methodology
Source: BLS, OEWS, 7-year dataset (–). Per-city data from annual BLS metropolitan area surveys.
2026 figures are projected from 2025 BLS data using a compound annual growth rate (CAGR) of 5.44%, derived from historical BLS wage trends for pharmacy technicians (SOC 29-2052).
Compiled and verified by Emily Tran, PharmD, a licensed pharmacy technician with 10+ years of clinical experience. · View source data at BLS.gov