Pharmacy Technician Salary in Oregon: $58,942 (2026)
Quick Answer:Across Oregon's 36 metropolitan areas, the average median pharmacy technician pay sits at $58,942/year heading into 2026 — a figure projected from 2025 BLS OEWS wage data for SOC 29-2052. Because Oregon sits at BEA RPP 102.6 (3% above the U.S. baseline), that statewide median translates to roughly $57,448 in nationally-comparable purchasing power. Highest-paying metros: Hillsboro ($59,924), Portland ($58,590), Bend ($56,950).
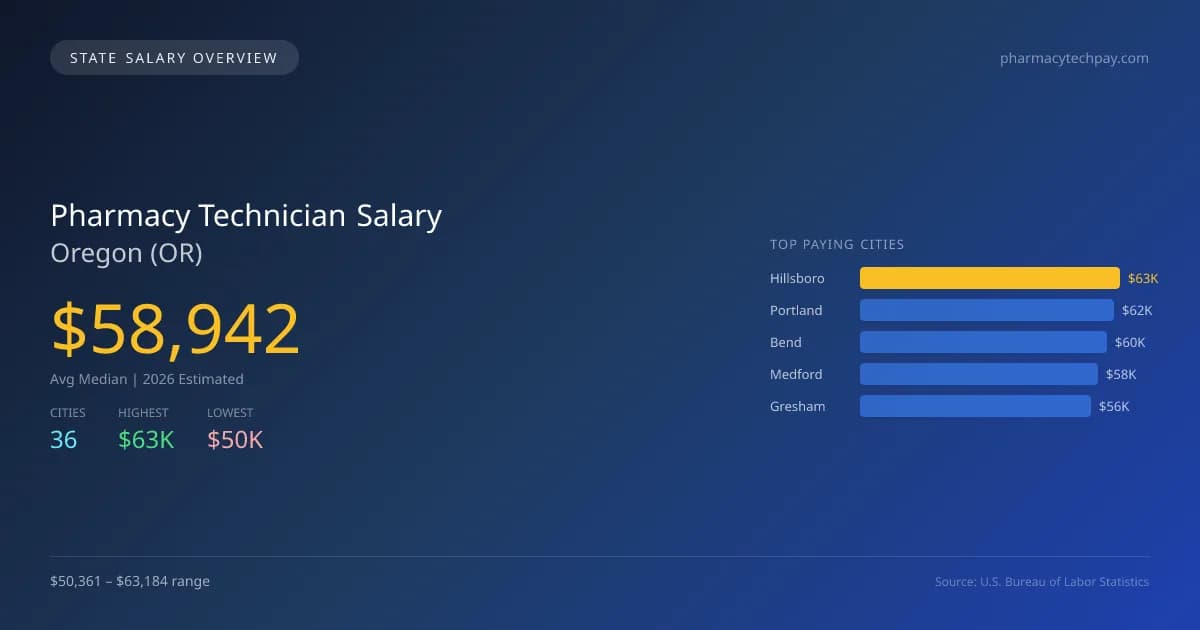
Oregon's pharmacy technician salaries, projected for 2026, reflect a significant advantage over national averages. The average median salary for pharmacy technicians in the state is projected to be $58,942, which is 22.2% higher than the national median of $48,239. The highest-paying city is Hillsboro, with an average salary of $63,184, while Milwaukie offers the lowest at $50,361, resulting in a salary gap of $12,823. This difference can be attributed to various factors, including the cost of living, local demand for healthcare services, and the concentration of pharmacies in certain areas. Oregon's pharmacy technicians are required to meet state licensing requirements and follow established scope of practice laws, which can influence the job market. The state’s strong focus on healthcare and a growing population contribute to a projected annual growth rate of 5.44% in the sector. The top five cities for job opportunities include Hillsboro, Portland at $61,777, Bend at $60,048, Medford at $57,887, and Gresham at $56,069. As the industry expands, opportunities for pharmacy technicians in Oregon are likely to remain strong, driven by an increasing demand for pharmaceutical services across the state.
Oregon Pharmacy Technician Salary Range
Overall salary range in Oregon: $40,531 (lowest entry-level) to $84,033 (highest top earner)
Oregon vs National Average
Oregon pharmacy technicians earn 22.19% more than the national median (+$10,703/year difference).
Oregon Pharmacy Technician Salary Distribution (2026)
Pharmacy Technician salaries in Oregon range from $47,082 (entry-level, 10th percentile) to $72,551 (top earners, 90th percentile), with a median of $58,942. The Oregon median is $10,703 above the US national median of $48,239. The average hourly rate is $28.34/hr. Approximately 4,384 pharmacy technicians are employed across 36 cities.
2019 BLS Actual
$42,720
2025 BLS Actual
$55,901
2026 Current Est.
$58,942
2019–2027 Growth
+45.5%
Salary Trajectory for Pharmacy Technicians in Oregon (2019–2027)
2019–2025: actual BLS OEWS data for this metro area. 2026+: CAGR 5.44% projection.
| Year | Annual Salary | Status |
|---|---|---|
| 2019 | $42,720 | Actual |
| 2020 | $43,684 | Actual |
| 2021 | $46,199 | Actual |
| 2022 | $46,928 | Actual |
| 2023 | $50,154 | Actual |
| 2024 | $52,917 | Actual |
| 2025 | $55,901 | Actual |
| 2026(current) | $58,942 | Estimated |
| 2027 | $62,148 | Projected |
Based on 7 years of BLS OEWS data for the Oregon metropolitan area, the median pharmacy technician salary grew 30.9% from $42,720 (2019) to $55,901 (2025). At a 5.44% compound annual growth rate, salaries are projected to reach $62,148 by 2027 — a total increase of $19,428 (45.48%) from 2019.
Note: Historical values (2019–2025) are actual BLS OEWS figures for the Oregon metropolitan area, sourced from annual Occupational Employment and Wage Statistics surveys. 2026–2026 figures are current estimates, and 2027 values are projections, calculated using a 5.44% CAGR derived from 7-year BLS historical data. Actual salaries may vary based on employer, experience, certifications, and local market conditions.
Top 5 Highest Paying Cities in Oregon
Lowest Paying Cities in Oregon
| City | Median Salary |
|---|---|
| Milwaukie | $50,361 |
| Klamath Falls | $50,482 |
| The Dalles | $50,786 |
| Newberg | $51,335 |
| Canby | $51,618 |
Best Value Cities for Pharmacy Technicians in Oregon
When adjusted for local cost of living, these Oregon cities offer the most purchasing power for pharmacy technicians.
| City | Nominal Salary | CoL Index | Adjusted Salary |
|---|---|---|---|
| Hillsboro | $63,184 | 102.6 | $61,583 |
| Portland | $61,777 | 105.421 | $58,600 |
| Bend | $60,048 | 103.607 | $57,957 |
| Medford | $57,887 | 101.433 | $57,069 |
| Grants Pass | $54,512 | 97.76 | $55,761 |
Adjusted salary = nominal salary × (100 / CoL index). CoL index: 100 = national average. Lower index = lower cost of living.
Salary by Experience Level in Oregon
| Experience Level | Estimated Annual |
|---|---|
| Entry Level (0-2 years) | $47,082 |
| Mid Career (3-7 years) | $58,942 |
| Experienced (7+ years) | $72,551 |
Estimates based on BLS percentile data averaged across Oregon metro areas. Individual pay varies by employer, certifications, and specialization.
All 36 Cities in Oregon
| # | City | Median Salary |
|---|---|---|
| 1 | Hillsboro | $63,184 |
| 2 | Portland | $61,777 |
| 3 | Bend | $60,048 |
| 4 | Medford | $57,887 |
| 5 | Gresham | $56,069 |
| 6 | Salem | $55,050 |
| 7 | Albany | $54,544 |
| 8 | Grants Pass | $54,512 |
| 9 | Beaverton | $54,472 |
| 10 | McMinnville | $54,325 |
| 11 | Oregon City | $54,260 |
| 12 | Woodburn | $53,900 |
| 13 | Lake Oswego | $53,640 |
| 14 | Eugene | $53,585 |
| 15 | Forest Grove | $53,500 |
| 16 | Tigard | $53,275 |
| 17 | Redmond | $53,258 |
| 18 | West Linn | $53,105 |
| 19 | Corvallis | $53,005 |
| 20 | Springfield | $52,892 |
| 21 | Tualatin | $52,645 |
| 22 | Pendleton | $52,641 |
| 23 | Wilsonville | $52,564 |
| 24 | Happy Valley | $52,113 |
| 25 | Hermiston | $51,969 |
| 26 | Central Point | $51,944 |
| 27 | Ashland | $51,940 |
| 28 | Keizer | $51,926 |
| 29 | Sherwood | $51,924 |
| 30 | Coos Bay | $51,836 |
| 31 | Roseburg | $51,648 |
| 32 | Canby | $51,618 |
| 33 | Newberg | $51,335 |
| 34 | The Dalles | $50,786 |
| 35 | Klamath Falls | $50,482 |
| 36 | Milwaukie | $50,361 |
More Oregon Salary Data
Senior / Experienced
Top earner salaries for experienced pharmacy technicians.
Explore More Pharmacy Technician Salary Data
Frequently Asked Questions
How much do pharmacy technicians make in Oregon in 2026?
What is the highest paying city for pharmacy technicians in Oregon?
How does Oregon pharmacy technician pay compare to the national average?
What is the entry-level pharmacy technician salary in Oregon?
How many pharmacy technicians are employed in Oregon?
Which Oregon city offers the best value for pharmacy technicians?
Written by Emily Tran, PharmD
Career Analyst
Emily Tran has over 8 years of experience as a pharmacy technician. She specializes in medication therapy management. Her experience includes working in community pharmacies.
Methodology & Data Source
Statewide salary figures on this page are 2026 projections based on the Bureau of Labor Statistics Occupational Employment and Wage Statistics (OEWS) survey, May 2026 release. A 5.44% compound annual growth rate (CAGR), derived from 6-year national BLS wage trends, was applied to each metro area's reported salary to estimate current 2026 pharmacy technician compensation across Oregon. State averages are employment-weighted across 36 metro areas — larger metro areas with more pharmacy technicianscontribute proportionally more to the average, producing figures that better reflect typical compensation. Individual pay varies by city, employer, certifications, and experience.
Data Sources & Methodology
Source: BLS, OEWS, 7-year dataset (–). Per-city data from annual BLS metropolitan area surveys.
2026 figures are projected from 2025 BLS data using a compound annual growth rate (CAGR) of 5.44%, derived from historical BLS wage trends for pharmacy technicians (SOC 29-2052).
Compiled and verified by Emily Tran, PharmD, a licensed pharmacy technician with 10+ years of clinical experience. · View source data at BLS.gov