Pharmacy Technician Salary in Nevada: $50,683 (2026)
Quick Answer:Across Nevada's 9 metropolitan areas, the average median pharmacy technician pay sits at $50,683/year heading into 2026 — a figure projected from 2025 BLS OEWS wage data for SOC 29-2052. Because Nevada sits at BEA RPP 98.3 (2% below the U.S. baseline), that statewide median translates to roughly $51,560 in nationally-comparable purchasing power. Highest-paying metros: Reno ($50,290), Carson City ($49,620), Las Vegas ($47,590).
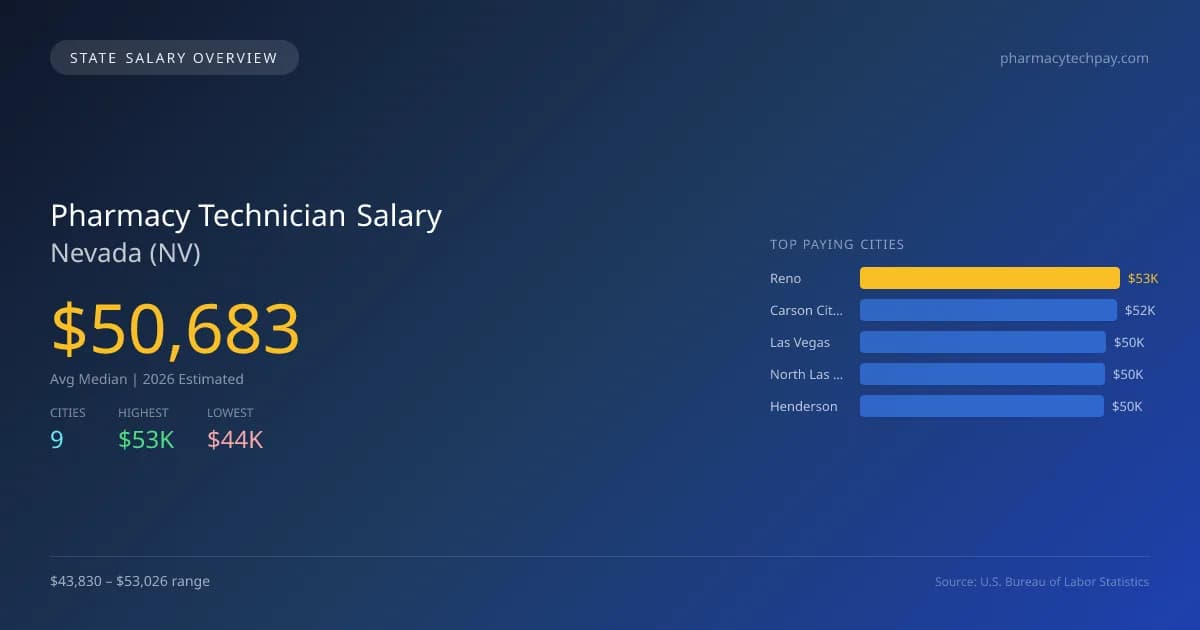
In 2026, the average median salary for pharmacy technicians in Nevada is projected to be $50,683, which is 5.1% higher than the national median of $48,239. The salary range across different cities in Nevada varies significantly, with Reno offering the highest average salary at $53,026, while Fernley sits at the lowest end with $43,830. This salary gap of $9,196 can be attributed to factors such as the cost of living, demand for pharmacy services, and competition among employers in urban versus rural areas. Nevada has specific licensing requirements and scope of practice laws that impact the role of pharmacy technicians, which can influence salary levels. The state's growing population and healthcare demands are driving a strong job market, with a projected annual growth rate of 5.44% for pharmacy technician positions. The top five cities in terms of projected salaries for 2026 are Reno at $53,026, Carson City at $52,319, Las Vegas at $50,179, North Las Vegas at $49,968, and Henderson at $49,711. With a total of 4,001 pharmacy technicians currently employed, opportunities in the field are expected to expand, particularly in metropolitan areas where demand is greater.
Nevada Pharmacy Technician Salary Range
Overall salary range in Nevada: $35,142 (lowest entry-level) to $70,795 (highest top earner)
Nevada vs National Average
Nevada pharmacy technicians earn 5.07% more than the national median (+$2,444/year difference).
Nevada Pharmacy Technician Salary Distribution (2026)
Pharmacy Technician salaries in Nevada range from $39,371 (entry-level, 10th percentile) to $65,890 (top earners, 90th percentile), with a median of $50,683. The Nevada median is $2,444 above the US national median of $48,239. The average hourly rate is $24.37/hr. Approximately 4,001 pharmacy technicians are employed across 9 cities.
2019 BLS Actual
$37,104
2025 BLS Actual
$48,068
2026 Current Est.
$50,683
2019–2027 Growth
+44.0%
Salary Trajectory for Pharmacy Technicians in Nevada (2019–2027)
2019–2025: actual BLS OEWS data for this metro area. 2026+: CAGR 5.44% projection.
| Year | Annual Salary | Status |
|---|---|---|
| 2019 | $37,104 | Actual |
| 2020 | $38,536 | Actual |
| 2021 | $37,218 | Actual |
| 2022 | $40,276 | Actual |
| 2023 | $44,402 | Actual |
| 2024 | $46,792 | Actual |
| 2025 | $48,068 | Actual |
| 2026(current) | $50,683 | Estimated |
| 2027 | $53,440 | Projected |
Based on 7 years of BLS OEWS data for the Nevada metropolitan area, the median pharmacy technician salary grew 29.5% from $37,104 (2019) to $48,068 (2025). At a 5.44% compound annual growth rate, salaries are projected to reach $53,440 by 2027 — a total increase of $16,336 (44.03%) from 2019.
Note: Historical values (2019–2025) are actual BLS OEWS figures for the Nevada metropolitan area, sourced from annual Occupational Employment and Wage Statistics surveys. 2026–2026 figures are current estimates, and 2027 values are projections, calculated using a 5.44% CAGR derived from 7-year BLS historical data. Actual salaries may vary based on employer, experience, certifications, and local market conditions.
Top 5 Highest Paying Cities in Nevada
Lowest Paying Cities in Nevada
Best Value Cities for Pharmacy Technicians in Nevada
When adjusted for local cost of living, these Nevada cities offer the most purchasing power for pharmacy technicians.
| City | Nominal Salary | CoL Index | Adjusted Salary |
|---|---|---|---|
| Carson City | $52,319 | 98.13 | $53,316 |
| Reno | $53,026 | 101.014 | $52,494 |
| North Las Vegas | $49,968 | 98.3 | $50,832 |
| Henderson | $49,711 | 98.3 | $50,571 |
| Las Vegas | $50,179 | 100.215 | $50,071 |
Adjusted salary = nominal salary × (100 / CoL index). CoL index: 100 = national average. Lower index = lower cost of living.
Salary by Experience Level in Nevada
| Experience Level | Estimated Annual |
|---|---|
| Entry Level (0-2 years) | $39,371 |
| Mid Career (3-7 years) | $50,683 |
| Experienced (7+ years) | $65,890 |
Estimates based on BLS percentile data averaged across Nevada metro areas. Individual pay varies by employer, certifications, and specialization.
All 9 Cities in Nevada
| # | City | Median Salary |
|---|---|---|
| 1 | Reno | $53,026 |
| 2 | Carson City | $52,319 |
| 3 | Las Vegas | $50,179 |
| 4 | North Las Vegas | $49,968 |
| 5 | Henderson | $49,711 |
| 6 | Sparks | $47,841 |
| 7 | Mesquite | $44,593 |
| 8 | Elko | $44,368 |
| 9 | Fernley | $43,830 |
More Nevada Salary Data
Senior / Experienced
Top earner salaries for experienced pharmacy technicians.
Explore More Pharmacy Technician Salary Data
Frequently Asked Questions
How much do pharmacy technicians make in Nevada in 2026?
What is the highest paying city for pharmacy technicians in Nevada?
How does Nevada pharmacy technician pay compare to the national average?
What is the entry-level pharmacy technician salary in Nevada?
How many pharmacy technicians are employed in Nevada?
Which Nevada city offers the best value for pharmacy technicians?
Written by Emily Tran, PharmD
Career Analyst
Emily Tran has over 8 years of experience as a pharmacy technician. She specializes in medication therapy management. Her experience includes working in community pharmacies.
Methodology & Data Source
Statewide salary figures on this page are 2026 projections based on the Bureau of Labor Statistics Occupational Employment and Wage Statistics (OEWS) survey, May 2026 release. A 5.44% compound annual growth rate (CAGR), derived from 6-year national BLS wage trends, was applied to each metro area's reported salary to estimate current 2026 pharmacy technician compensation across Nevada. State averages are employment-weighted across 9 metro areas — larger metro areas with more pharmacy technicianscontribute proportionally more to the average, producing figures that better reflect typical compensation. Individual pay varies by city, employer, certifications, and experience.
Data Sources & Methodology
Source: BLS, OEWS, 7-year dataset (–). Per-city data from annual BLS metropolitan area surveys.
2026 figures are projected from 2025 BLS data using a compound annual growth rate (CAGR) of 5.44%, derived from historical BLS wage trends for pharmacy technicians (SOC 29-2052).
Compiled and verified by Emily Tran, PharmD, a licensed pharmacy technician with 10+ years of clinical experience. · View source data at BLS.gov